
All courses · Course overview · Lesson sequence
Skip to lesson textObserve the application without confusing the signals
The offline evaluation passed, yet users now report that support feels unreliable. A route score cannot tell you whether requests are failing before a response, waiting in a queue, or receiving an unsupported answer. Observation begins by deciding which event and denominator each signal represents.
You will calculate an operational good-request fraction, avoid double-counting failures, distinguish an objective from an observation, and write an actionable alert. The program replays invented window summaries; it does not collect telemetry, start a server, read logs, or monitor Aabha.
Name the request boundary
A useful operational event might include a synthetic request ID, system revision, completion status, start and finish definitions, duration, and a route category. Actual content is not automatically necessary. Before collecting real events, decide which permitted fields answer the operational question, who can access them, and how long they are retained.
For our example, a request begins at application acceptance and ends at a complete usable response or a declared failure, including any retries inside that application boundary. The fixture has already aggregated these invented requests into ordered windows w1–w4. Each window contains exactly 100 candidate requests and an equal-sized fictional control observation. These are request-count windows, not measured minutes or a claim about real traffic.
An error here means a request failed the declared operational completion condition. A slow request exceeds the example's duration condition. bad_requests is the union of error and slow IDs, not the sum of two counters. critical independently counts requests with a critical quality failure: a fast technically successful response can still violate a boundary. This schema cannot demonstrate how events were actually collected or deduplicated; it merely validates plausible supplied counts.
Work the denominator before the percentage
In w1, there is one error and two slow requests. The one error is also slow. Therefore the union has 1 + 2 - 1 = 2 bad requests. Good fraction is (100-2)/100 = 0.98, not 0.97. Counting each failure mode as a different failed user request would double-count the overlap.
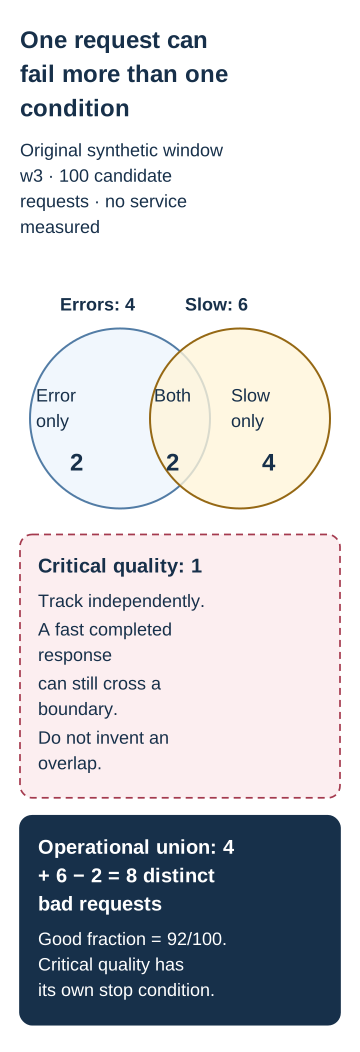
In w3, four errors and six slow requests overlap on two requests, giving eight bad requests. Its good fraction is 0.92. A separate critical count is one. That critical condition matters even if a broad operational target were met.
If the diagram extends beyond the screen, scroll inside it or read the text version below.
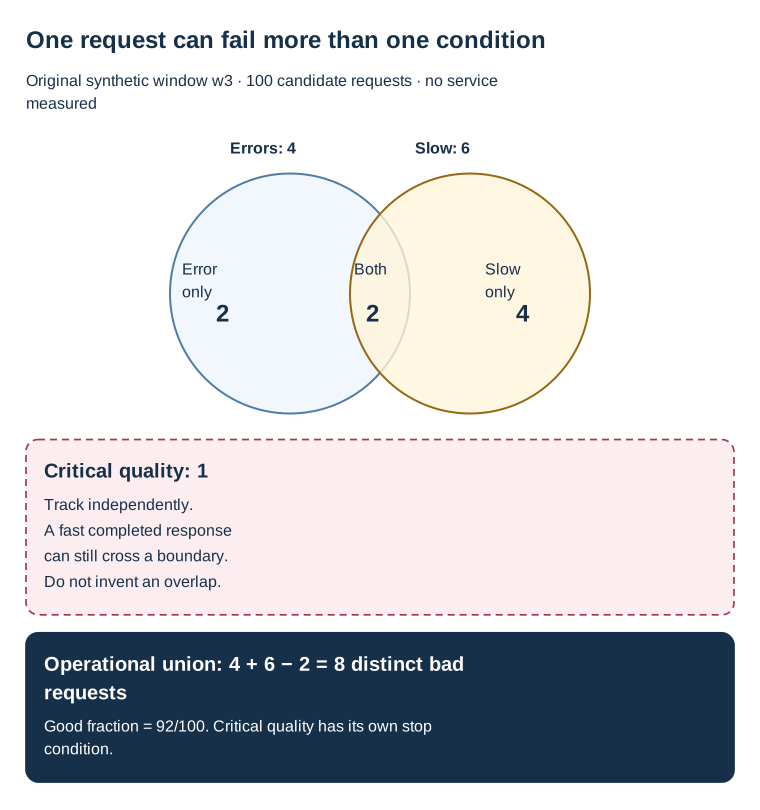
Read the diagram as text
- One request can fail more than one condition
- Original synthetic window w3 · 100 candidate requests · no service measured
- Errors: 4
- Slow: 6
- Error only
- 2
- Both
- 2
- Slow only
- 4
- Critical quality: 1
- Track independently.
- A fast completed response
- can still cross a boundary.
- Do not invent an overlap.
- Operational union: 4 + 6 − 2 = 8 distinct bad requests
- Good fraction = 92/100. Critical quality has its own stop condition.
Text alternative: errors total four and slow requests total six, with two in both sets. Count the overlap once to obtain eight distinct operationally bad requests. Critical quality is an independent request count and may also fail on a fast operational success.
Run from project:
python3 -B opslab.py monitor
The illustrative objective is 98% good requests in each supplied window. An SLI is the measured indicator; an SLO is its agreed target and evaluation conditions. Google's service-level objectives chapter emphasizes specifying the measurement and validity conditions. Our 98% target is a teaching choice, not an Aabha commitment or a recommended universal objective.
At this objective, a 100-request window has a budget of two bad requests. The program's burn_multiple is the bad fraction divided by the permitted bad fraction: for w3, 0.08 / 0.02 = 4. It means this window consumes the per-request allowance at four times the example target. It does not calculate hours until a monthly budget is exhausted. Such a forecast would need a defined time horizon, traffic, and previous budget consumption.
Avoid a flattering latency average
Consider a different synthetic collection: ninety successful requests take 500 ms each, while ten failures return in 5 ms. Aggregate mean latency is (90×500 + 10×5)/100 = 450.5 ms. The system can appear faster because it failed quickly. The successful-request mean remains 500 ms, and 10% of requests failed. Separate success and failure latency rather than interpreting 450.5 ms as an improved user experience.
The monitoring chapter distinguishes these latency populations and discusses latency, traffic, errors, and saturation. Our fixture supplies invented p95 and counts but no saturation measurements. A monitoring design should acknowledge that missing signal rather than claim all operational dimensions are covered.
Make an alert lead to a decision
The replay flags an operational alert when the good fraction falls below 0.98 or the supplied p95 exceeds 700 ms. It separately flags critical cases for quality review. w3 has both kinds of flag. Every report names a fictional application owner and the action “inspect matched window; hold expansion.” This is a paper instruction; no message or page is sent.
A real alert also needs a defined evaluation window, handling for no data and duplicate events, a known owner, a runbook, and a criterion for clearing it. A missing denominator should produce “insufficient evidence,” not 100% success. Slow sampling can conceal a short severe failure; excessively sensitive checks can create noise. Those choices need realistic failure and workload evidence, not a copied threshold.
Practice
- Calculate
w1andw3good fractions, union overlaps, and budget multiples by hand. Explain why the critical count is tracked separately rather than blindly added tobad_requests. - Recalculate the fast-error latency example. Write the two other facts that must accompany its 450.5 ms aggregate mean.
- Write an event schema of six minimal fields for the fictional router. Exclude message content unless you can state a specific need. Define the timing boundary.
- Draft an alert note for
w3: denominator, condition, owner, immediate action, and a missing signal. State explicitly that the output is a simulated alert.
Your exit artifact is an SLI definition and an actionable monitoring note, not a running monitor. Explained solutions.