
Statistics · Module 7
Put a range around an estimate
A point estimate is useful, but it does not tell the reader how precisely the underlying quantity is estimated. A confidence interval adds a range produced by a stated method. It should travel with the point estimate and the design assumptions, rather than appear as a decorative pair of brackets.
We begin with the mean duration in the control arm of the simulated checklist trial. The target is the mean for repeated independent tasks generated under this teaching model, not the duration of the next individual task and not a real workforce average.
Build one interval step by step
The 20 control outcomes have mean 23.9895 minutes and sample SD 4.1254 minutes. We estimate the standard error by dividing SD by √20, obtaining about 0.9225 minutes. A two-sided 95% Student-t interval uses a multiplier from a t distribution with n − 1 = 19 degrees of freedom. That multiplier is about 2.093. You can use the supplied result without deriving the t distribution.
Multiply the standard error by the multiplier: 2.093 × 0.9225 ≈ 1.9307 minutes. This is the margin of error under the method. Subtract and add it to the mean: 23.9895 − 1.9307 ≈ 22.06 and 23.9895 + 1.9307 ≈ 25.92 minutes. The exact calculation appears in the reference output; the lesson rounds intermediate values for readability.
The logic is estimate, plus or minus a method-based allowance for sampling variability. Greater individual variation widens the allowance. More independent observations generally narrow it. A higher confidence level, such as 99%, uses a larger multiplier and yields a wider interval for the same data.
The t method is exact for independent, identically distributed normal observations when the variance is unknown. It can be a useful approximation under some departures, but an interval computed without considering skew, outliers and dependence has not earned its interpretation. The simulated trial was constructed for this introductory model. A real study would require substantive checks of design and diagnostics; a passed normality test alone would not establish independence.
Interpret what is random
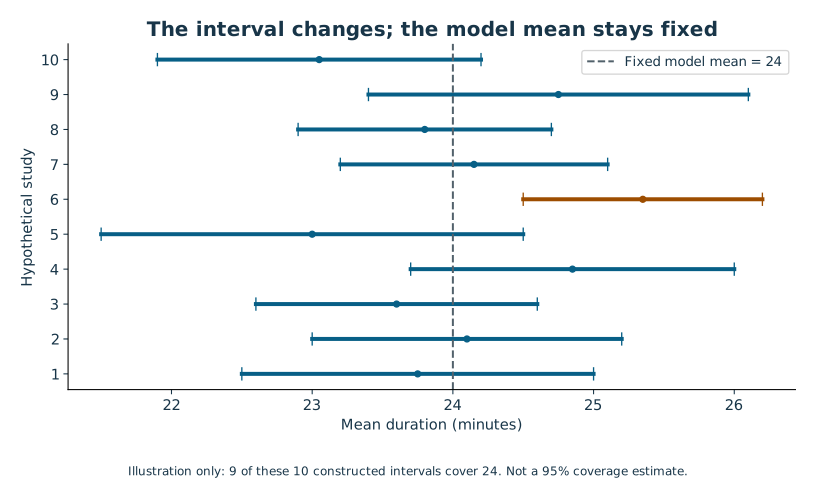
Before collecting a sample, the interval you will calculate is random because the data will vary. The underlying process mean is treated as fixed in this frequentist method. If we repeatedly sampled in the same way and computed 95% intervals, the procedure would cover that fixed mean in about 95% of repetitions when its assumptions hold. For the interval already observed, the fixed mean is either inside or outside.
Do not translate 95% into “95% of individual tasks took between 22.06 and 25.92 minutes.” The interval concerns the mean. Individual durations have much wider variation. Do not say the data give a 95% probability that the fixed mean lies inside this particular interval under the frequentist procedure. A Bayesian probability interval requires an explicit prior and model, which this course does not teach.
A practical wording is: “The estimated control mean was 23.99 minutes; a 95% t-confidence interval was approximately 22.06 to 25.92 minutes under the independent normal-process model.” This is concise without pretending the interval covers every source of uncertainty.
Read the diagram explanation
Ten constructed illustrative intervals, nine covering a fixed mean of 24 and one missing it. This is not a random simulation or an empirical 95% coverage claim.
What is outside the interval's protection
The margin of error does not automatically include biased recruitment, instrument error, missing outcomes, changing operations or a wrong model. A narrow interval from the wrong population can be confidently irrelevant. In the shipment file, a naive interval treating all 240 records as independent would ignore the shared weekly conditions. The required course avoids that calculation rather than teaching a falsely precise number.
An interval for a mean is also not a prediction interval for a future observation. A future task brings its own individual noise in addition to uncertainty about the mean, so its predictive range is usually wider under the same model. If the manager asks for a promise that covers most future deliveries, a mean-confidence interval is answering the wrong question.
Compare to a meaningful target cautiously
Suppose a fictional planning target is a mean below 23 minutes. The control interval spans 23. These data do not clearly distinguish a process mean just below that target from one above it under this method. It would be incorrect to conclude “the target is met” merely because part of the interval is below 23. A target is a decision criterion, and an interval describes estimation uncertainty; neither eliminates the other.
Next we will estimate a difference between two groups. Comparing two separate mean intervals by eye is not the same as computing the interval for their difference. Use a method that directly matches the question.
Attempt Practice 7A–7C. Rewrite one tempting misinterpretation and explain what additional information would be needed to estimate a future individual's duration.
Further reading: NIST's confidence limits for the mean and SciPy's t distribution.
Read the separate answers and explanations
Reading progress
12 lessons remain open to guests. Marking a lesson read records reading only; it does not award assessment credit or a certificate.
Device reading marks require browser storage. Reading is always available.
Sign in or create an account to save separate account progress. Your current page is kept.
Your earlier place on this device suggests these lessons. No new lesson is marked read.