
Reference capstone for comparison after your attempt
There is more than one defensible recommendation. This example illustrates the evidence standard. Reproduce the values and critique the wording rather than copying it into your submission.
Plan and calculation record
Population for description: the 240 fictional recorded shipments in weeks 1–8. Unit: shipment. Late: actual_minutes strictly exceeds promised_minutes. Rating missingness does not invalidate otherwise valid shipment timing. Exploratory question: whether late shipments have different rating response coverage. Population for inference: repeated independent tasks under the simulated trial model, with 20 independent participants per randomized arm. Contrast: checklist minus control mean duration; negative means faster. Practical threshold: −2 minutes or lower, supplied for the exercise.
Raw accounting: 248 records = 240 accepted + 3 exact duplicates + 5 invalid extras. Six formatting cells were normalized and two stale late flags recomputed; these are cell-level corrections, not extra excluded rows. There are 240 distinct clean shipment IDs and 30 shipments per week. The raw file remains unchanged.
| Quantity | Reference result |
|---|---|
| Overall late | 51/240 = 21.25% |
| Actual duration | Mean 62.7942; median 62.2; sample SD 26.2236 minutes |
| Linear quartiles and IQR | Q1 45.05; Q3 77.975; IQR 32.925 minutes |
| East late / West late | 25/120=20.83% / 26/120=21.67% |
| East / West mean actual minutes | 79.6275 / 45.9608 |
| East / West mean distance km | 36.85 / 18.6725 |
| East / West priority share | 40/120=33.33% / 80/120=66.67% |
| Rating coverage | 199 responses, 41 missing out of 240 |
| Missing among late / on time | 20/51=39.22% / 21/189=11.11% |
| Respondent rating mean | 4.1357, on an ordered 1–5 scale |
| Trial control | n20, mean23.9895, sample SD4.1254 minutes |
| Trial checklist | n20, mean20.7880, sample SD4.1477 minutes |
| Checklist minus control | −3.2015 minutes; −13.3454% relative to control mean |
| Welch inference | SE1.3081; t−2.4475; df37.9989; two-sided p0.01912 |
| 95% difference interval | [−5.8496,−0.5534] minutes |
Appropriate charts: the supplied effect-interval design with a learner-authored caption; a two-category dot or bar display of missing-rating percentages by late status, labelled 20/51 and 21/189. For comparison after your attempt, assets/missingness.svg illustrates the second chart. These plots answer different questions. An actual-time hub chart alone would not establish hub performance.
Five-record spot-check
These checks use the clean file and the strict actual > promise boundary. The raw audit records why corrupted extra rows were excluded.
| Shipment | Actual minutes | Promise minutes | Derived late | Stored late | Rating |
|---|---|---|---|---|---|
| S0001 | 96.1 | 99.3 | 0 | 0 | 4 |
| S0002 | 64.6 | 77.7 | 0 | 0 | 5 |
| S0003 | 68.6 | 75.0 | 0 | 0 | 3 |
| S0004 | 111.2 | 92.8 | 1 | 1 | Missing |
| S0240 | 45.5 | 51.9 | 0 | 0 | 4 |
All five derived late flags equal their stored flags. A blank optional rating is preserved as missing and does not remove the shipment. Rating counts among all 199 respondents are 1: 1, 2: 7, 3: 31, 4: 85, 5: 75; these show the ordered distribution alongside the mean.
Reference charts and text equivalents
Read the diagram explanation
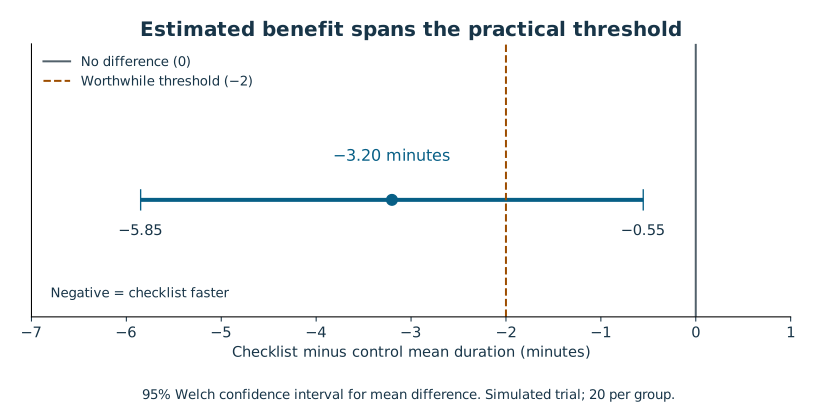
Checklist minus control is −3.2015 minutes, with a 95% Welch interval of −5.8496 to −0.5534. It excludes zero but crosses the −2-minute hypothetical worthwhile threshold. Simulated trial, 20 per group.
The trial chart shows the mean difference directly. Its interval crosses the hypothetical −2-minute threshold, so a zero-null rejection does not establish that threshold.
Read the diagram explanation
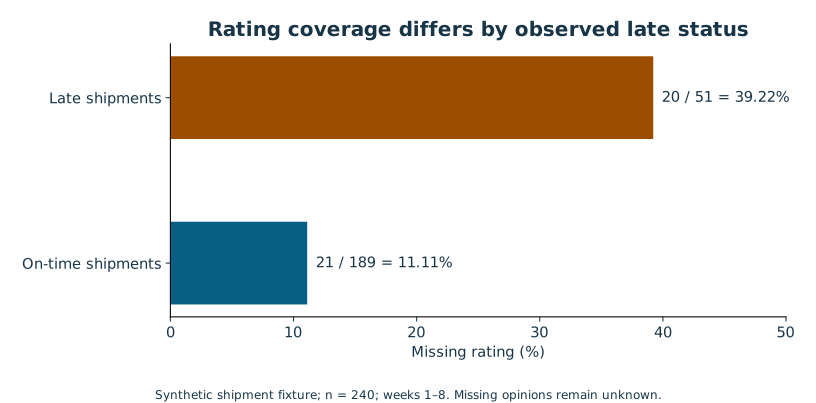
20 of 51 late shipments lack ratings (39.22%), compared with 21 of 189 on-time shipments (11.11%). Observational synthetic fixture; no missing opinions are inferred.
Rating coverage is worse among late shipments in this generated fixture. This does not reveal the unobserved ratings or quantify the exact bias in the all-shipment mean.
Example management brief
Plan a real controlled checklist pilot, and investigate rating-response coverage before using average ratings as a service score. The supplied evidence is a fictional teaching dataset, so it can demonstrate an analysis approach but cannot establish operational effectiveness in a real business.
Across the 240 recorded synthetic shipments in weeks 1–8, 51 were late, or 21.25%. East and West had similar observed late fractions, 25/120 and 26/120 respectively, despite very different average delivery times. East also handled longer routes and a smaller priority-service share. A raw duration ranking therefore does not isolate hub performance. Compare sufficiently overlapping route and service groups and review promise definitions before attributing differences to a hub.
Rating coverage deserves attention: 20 of 51 late shipments lacked ratings, compared with 21 of 189 on-time shipments. The respondent mean of 4.14 therefore describes 199 respondents, with uncertain relevance to all 240 shipments. Investigate response barriers and retain the missingness breakdown alongside any satisfaction headline.
In the separate simulated randomized trial, the checklist mean was 3.20 minutes lower than control. The 95% Welch interval corresponds to a reduction of about 0.55–5.85 minutes. It excludes zero but includes improvements below the hypothetical 2-minute worthwhile threshold. A full rollout is not established as worthwhile, and the fixture measures neither implementation cost nor service-quality trade-offs.
For a real pilot, specify the assignment unit, primary duration outcome, adherence checks, relevant quality guardrails and stopping plan before collecting outcomes. Choose sample size using justified variability and practical-effect assumptions. Review the effect interval against the pre-specified threshold, together with cost and quality evidence. Reconsider the recommendation if the real setting differs materially from the simulated tasks or if quality deteriorates.
Methods and limitations
The optional companion uses exact dependency versions listed in requirements.txt; Python 3.12.14 was tested. Quartiles use NumPy's linear convention and SD uses n−1. The Welch interval and test share the same difference, SE and degrees of freedom. The random generator includes independent normal trial noise with a built-in constant reduction; the observed estimate varies because of assignment/noise. Rounding of CSV durations makes the normal model an excellent teaching approximation rather than literally continuous recorded values.
Shipment summaries are descriptive. They do not receive naive independent-shipment confidence intervals because weekly conditions are shared. Selective missingness is known from the generator but in a real study would require investigation; no exact missing opinions are inferred. A respondent rating mean assumes equal category spacing for that summary and should accompany ordered category counts.
A skeptical reviewer might ask whether a 0.6-minute real reduction would justify adoption. Under the given 2-minute threshold, it would not establish the desired benefit. This is why a zero-null rejection and a worthwhile-intervention decision are not interchangeable. The next study needs relevant outcomes and a design, not simply a larger spreadsheet.